


Global Shield is a defensive multi-asset portfolio that focuses on stability, risk reduction and global diversification. The combination of defensive equities, broadly diversified bonds and strategic commodities creates a robust protective shield against market volatility and economic uncertainties.
Performance
Performance table
| month | Value | Δ compared to the previous month | Δ since the beginning of the year |
|---|---|---|---|
| January | 105,00 € | 0,00 % | 0,00 % |
| February | 108,26 € | 3,10 % | 3,10 % |
| March | 105,16 € | -2,86 % | 0,15 % |
| April | 107,29 € | 2,03 % | 2,18 % |
| May | 108,02 € | 0,68 % | 2,88 % |
| June | 106,59 € | -1,32 % | 1,51 % |
| July | 108,35 € | 1,65 % | 3,19 % |
| August | – | – | – |
| September | – | – | – |
| October | – | – | – |
| November | – | – | – |
| December | – | – | – |
Strategy & approach
| Objective | Protection of capital employed and reduction of fluctuations |
|---|---|
| Realisation | High proportion of bonds and gold for stabilisation Equities as a source of returns, but with a lower weighting Commodities as an admixture for further diversification |
| Special feature | Defensive character - lower equity exposure compared to other core wikifolios |
Core information
| Start date | 16/09/2025 |
|---|---|
| Risk class | defensive |
| Investment universe | All ETFs available on Wikifolio.com |
| Fee model | 15% Performance fee |
| Strategy | Capital preservation through broad diversification with a focus on stable asset classes |
| Performance comparison | For comparison |
| Trading idea | complete trading idea on Wikifolio.com |
Portfolio breakdown
| Asset class | Share |
|---|---|
| Equity ETFs | 30 % |
| Bond ETFs | 50 % |
| Commodity ETCs | 20 % |
| Crypto ETCs | 0 % |
Basic structure & weighting (October 2025)
| ETF / asset class | ISIN | Weighting |
|---|---|---|
| Shares 30% | ||
| Invesco Global Active Defensive ESG Equity EUR-Hedged | IE000XIBT2R7 | 15% |
| Xtrackers MSCI World Consumer Staples | IE00BM67HN09 | 10% |
| iShares Edge MSCI EM Minimum Volatility | IE00B8KGV557 | 5% |
| Bonds 50% | ||
| iShares Global Aggregate Bond EUR-Hedged | IE00BDBRDM35 | 20% |
| iShares J.P. Morgan ESG $ EM Bond EUR-Hedged | IE00BKP5L730 | 9% |
| iShares Global High Yield Corp Bond EUR-Hedged | IE00091SR7N7 | 7% |
| iShares Global Inflation Linked Govt Bond EUR-Hedged | IE00BKPT2S34 | 7% |
| iShares € Ultrashort Bond | IE000RHYOR04 | 7% |
| Raw materials 20% | ||
| iShares Diversified Commodity Swap | IE00BDFL4P12 | 10% |
| Xetra-Gold | DE000A0S9GB0 | 10% |
Stock market coverage (October 2025)
| Asset class | Cover |
|---|---|
| Shares (30%) | approx. 600 companies ~85% of the stock market covered by market capitalisation |
| Bonds (50%) | approx. 22,000 bonds ~95% of the bond market covered |
| Raw materials (20%) | approx. 90% of the tradable commodity market covered |
Global equity market coverage (October 2025)
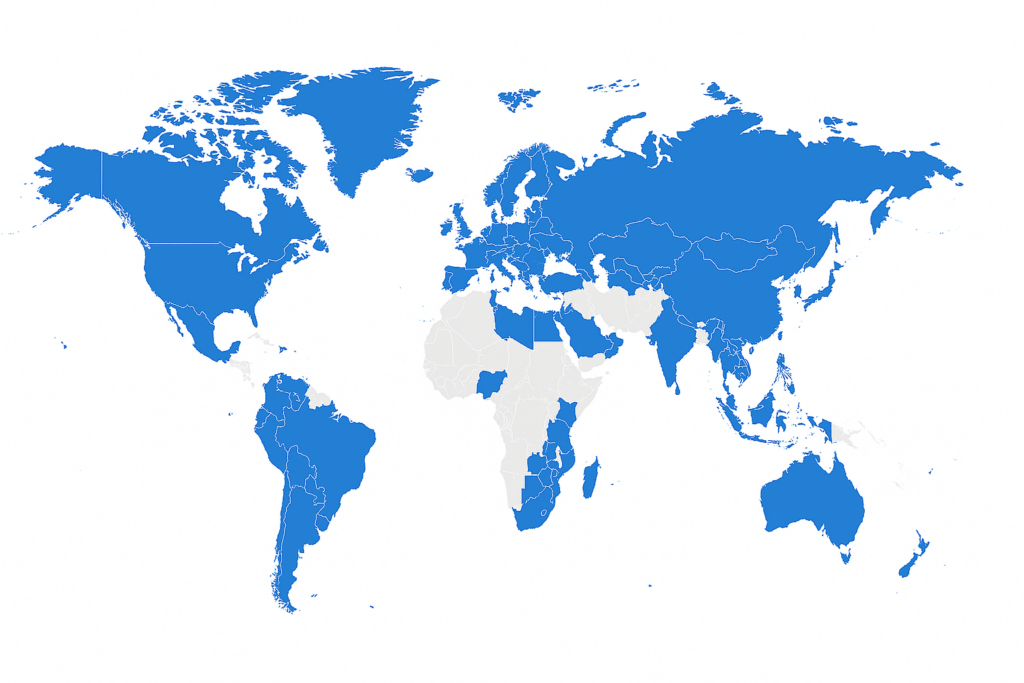
| Region | Share of total portfolio |
|---|---|
| North America | approx. 52% |
| Europe | approx. 18% |
| Pacific (Japan, Australia, New Zealand) | approx. 11% |
| Emerging markets (China, India, Taiwan, South Korea, etc.) | approx. 14% |
| Latin America | approx. 2% |
| Africa & Middle East | approx. 3% |
Sector allocation (October 2025)
| Industry | Share in the block of shares |
|---|---|
| Information technology | approx. 14% |
| Finances | approx. 10% |
| Industry | approx. 6% |
| Healthcare | approx. 8% |
| Cyclical consumption | approx. 4% |
| Non-cyclical consumption | approx. 40% |
| Communication services | approx. 6% |
| Energy | approx. 3% |
| Materials | approx. 4% |
| Provider | approx. 3% |
| Real estate | approx. 2% |