


Global Core & Trends combines a global core portfolio of broadly diversified equity markets with targeted factor and trend components. The approach combines stable market breadth with dynamic growth drivers to create a long-term equity portfolio that is both robust and opportunity-orientated.
Performance
Performance table
| month | Value | Δ compared to the previous month | Δ since the beginning of the year |
|---|---|---|---|
| January | 108,00 € | 0,00 % | 0,00 % |
| February | 111,18 € | 2,94 % | 2,94 % |
| March | 105,19 € | -5,39 % | -2,60 % |
| April | 115,23 € | 9,54 % | 6,69 % |
| May | 121,21 € | 5,19 % | 12,23 % |
| June | 124,15 € | 2,43 % | 14,95 % |
| July | 122,57 € | -1,27 % | 13,49 % |
| August | – | – | – |
| September | – | – | – |
| October | – | – | – |
| November | – | – | – |
| December | – | – | – |
Strategy & approach
| Objective | Mapping of the global equity markets with a focus on long-term capital growth |
|---|---|
| Realisation | Investment in international equities and ETFs covering different regions and sectors |
| Special feature | Concentration on equities as the main asset class, with no addition of bonds or commodities |
Core information
| Start date | 16/09/2025 |
|---|---|
| Risk class | opportunity-orientated |
| Investment universe | All equity ETFs available on Wikifolio.com |
| Fee model | 10% Performance fee |
| Strategy | Broad coverage of the global equity market |
| Performance comparison | For comparison |
| Trading idea | complete trading idea on Wikifolio.com |
Portfolio breakdown
| Asset class | Share |
|---|---|
| Equity ETFs | 100 % |
| Bond ETFs | 0 % |
| Commodity ETCs | 0 % |
| Crypto ETCs | 0 % |
Basic structure & weighting (October 2025)
| ETF / asset class | ISIN | Weighting |
|---|---|---|
| Shares 100% | ||
| iShares MSCI North America | IE00B14X4M10 | 36% |
| iShares Core MSCI Europe | IE00B4K48X80 | 12% |
| iShares MSCI World Small Cap | IE00BF4RFH31 | 7% |
| iShares MSCI EM Asia | IE00B5L8K969 | 6% |
| iShares Core MSCI Japan IMI | IE00BKT6FV49 | 4.5% |
| iShares Core MSCI Pacific ex-Japan | IE00B52MJY50 | 3.5% |
| iShares MSCI EM Latin America | IE00B27YCK28 | 1% |
| L&G Gerd Kommer Multifactor Equity | IE0001UQQ933 | 15% |
| iShares Edge MSCI World Momentum | IE00BP3QZ825 | 10% |
| iShares Edge MSCI EM Value Factor | IE00BG0SKF03 | 5% |
Stock market coverage (October 2025)
| Asset class | Cover |
|---|---|
| Shares (100%) | approx. 8,500 companies ~98% of the stock market covered by market capitalisation |
Global equity market coverage (October 2025)
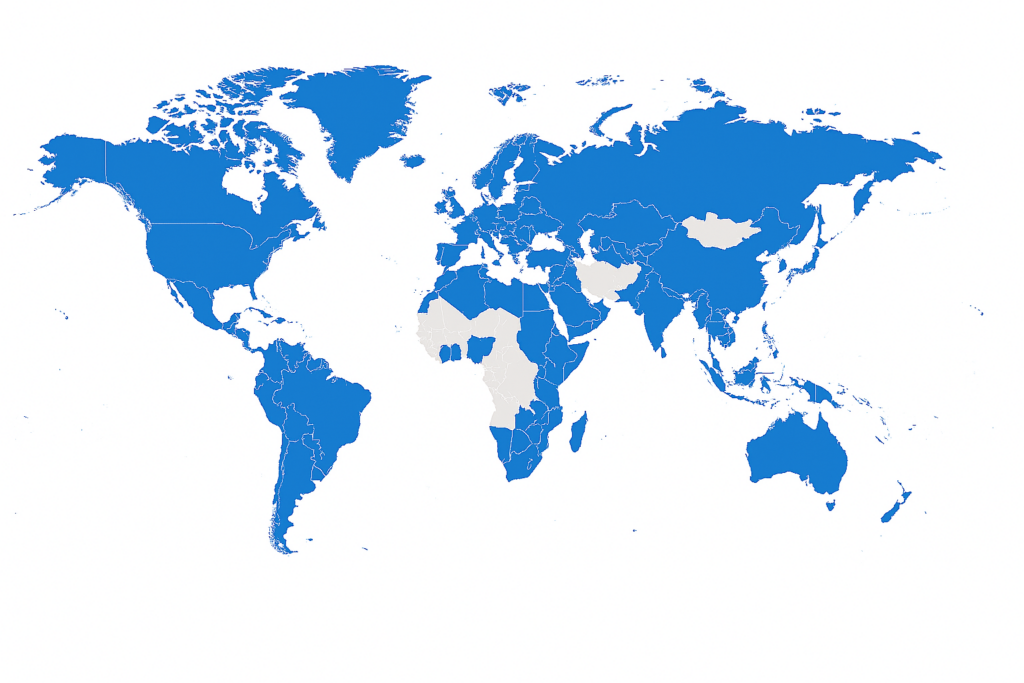
| Region | Share in the block of shares |
|---|---|
| North America | approx. 47% |
| Europe | approx. 18% |
| Pacific (Japan, Australia, New Zealand) | approx. 10% |
| Emerging markets (China, India, Taiwan, South Korea, etc.) | approx. 18% |
| Latin America | approx. 4% |
| Africa & Middle East | approx. 3% |
Sector allocation (October 2025)
| Industry | Share in the block of shares |
|---|---|
| Information technology | approx. 20% |
| Finances | approx. 16% |
| Industry | approx. 13% |
| Healthcare | approx. 12% |
| Cyclical consumption | approx. 11% |
| Non-cyclical consumption | approx. 7% |
| Communication services | approx. 7% |
| Energy | approx. 5% |
| Materials | approx. 4% |
| Provider | approx. 3% |
| Real estate | approx. 2% |